During the winter term 2025/26 I attended a course on digital history. As part of that course we were introduced to the FactGrid database, a Wikidata instance operated by a cooperation of Eurpean universities, research institutions and the Wikimedia Germany association.
Unlike Wikidata FactGrid requires the authors to disclose their real name, their institutional context (e.g. university, research institution) and track sources like one would in an academic publication.
During the course we learned how to model and import historical sources in the database.
A generic model for historical data
Historical data can be incredibly complex. Depending on their research interest, two historians (or teams thereof) will have vastly different formats in mind when setting up a database model. FactGrid tries to address this challenge by providing a data model that is flexible enough to accomodate a variety of different perspectives and still allow cooperation and interoperability between teams.
Instead of designing their own solution, FactGrid operates an instance of MediaWiki with the Wikibase extension. This is the same software that powers WikiData. To understand how FactGrid models historical data, let's go through an example of how a historical text can be turned into a knowledge graph that FactGrid can ingest. As a starting point I've written a short text about Empress Theophanu as you might find it in the introduction to a historical essay:
Theophanu Skleraina was Empress of the Holy Roman Empire by her marriage to Emperor Otto II. She was born in Constantinople into the imperial family of the Byzantine empire to Constantine Skleros and Sophia Phokaina. She died in Nijmegen after having co-ruled the German empire for eight years during her son Otto III.'s minority. 1
This introduction contains a couple of pieces of information about Theophanu that we now want to extract into a format that can be processed by the FactGrid database. To do that we first formulate a couple of simple statements following a uniform structure:
Theophanu was born in Constantinople.
Her father was Constantine Skleros.
Her mother was Sophia Phokaina.
Her husband was Otto II. Holy Roman Emperor.
Her son was Otto III. Holy Roman Emperor.
She died in Nijmegen.
Every statement declares one of Theophanu (our subject's) properties: Her birthplace, her father, mother, busband, son and place of death. Through these properties she relates to several other people and places. We can use these statements to create a simple graph of her relationships:

FactGrid can be thought of as a giant version of this small graph where every node is a historical event, person, place, organization, document or other entity and the edges represent their relationships through each entity's properties. In order to make connections between different parts of the graph, FactGrid defines a giant cataloge of properties. Before we can insert data into FactGrid, we have to search for the appropriate pre-defined properties. Each property has a number and is prefixed with a P. I've gone ahead and inserted the correct property numbers into our graph:

Now, we need to go through all the people and places that our model mentions and either find their entities in FactGrid or create new ones. Entity numbers use the letter Q as a prefix:

This is part of Theophanu's graph in the FactGrid database. Her FactGrid ID is Q16251 and on her page you can see a list of all the statements that contributors defined for her, along with IDs linking the entity to other projects (Wikipedia, the GND and others). Every statement begins with the property (e.g. children) and a list of objects that connect to Theophanu through this property:
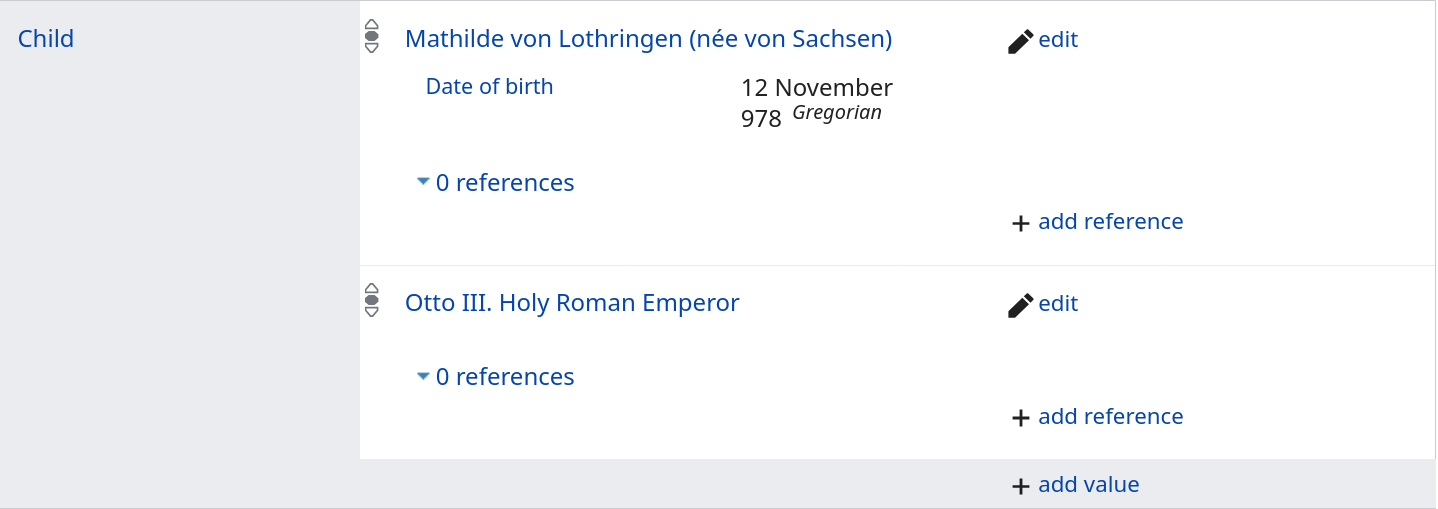
Besides these objects, each entry in the property's list can be accompanied by qualifiers and references to provide additional information and track sources. Not every property points to another entity. Some just store a literal value such as a date, string or number.
Because FactGrid relies on linking different entities together, it can be considered a graph database. And since it's statements follow the Subject-Property-Object format, our seminar also called it a triplet database. Next, let's see how I used the FactGrid database to import source data on the Great Ravensburg Trading Company.
Importing a larger dataset into FactGrid
In my last post on this website I discussed the Great Ravensburg Trading Company, it's history and the astonishing find of documents2 that allowed us to learn more about the internal operations of this company than any other German trading company at that time.
Dr. Olaf Simons suggested that I update some of the sparse data on the Great Ravensburg Trading Company in FactGrid and created a project page for me on FactGrid.
One of the easiest things to model in FactGrid is geneology: Some of the first properties defined by FactGrid were for family relationships (Father, Mother, Children, Partners, etc.) and the Ravensburg sources contain a lot of personal documents of the family of Alexius Hilleson. I was able to use marriage contracts, wills and contracts of sale to reconstruct the family tree over the course of three generations. I used the FactGrid query service to create a graph of the family that you can navigate.
For this task I went through and manually inserted all the family documents in Schulte's edition. Based on that experience I wanted to try something more ambitious.
Mapping the company's network
FactGrid provides the QuickStatements API to update and create batches of documents. The index of Aloys Schultes book lists 162 documents with title, locations and dates. Using this information I was able to insert 148 documents into the database, connect them to locations and dates. The result can be seen on the interactive map below. Each point indicates one place that at least one document was written in or mentioned. The map illustrates the extend and routes of the Ravensburg trading network.
The cluster of points around Ravensburg (Lindau - Memmingen, Kempten - Bad Waldsee) are the primary production centers of fastian, which the company exported. North of the Alps the company almost exclusively traded at the major fairs in Nürnberg, Frankfurt, Bruges and Antwerp. We have no indication that they ventured further north into the Hanseatic area.
In the time period that we have records, the company seems to have used two major trade routes:
- Over the Swiss plateau through Constance, Zürich, Bern and Geneva, down to Lyon, Avignon and finally Martigues where they'd charter ships to Barcelona and Valencia.
- Over the Alps, possibly via the Gotthard pass, through Milan and Genova to either Spain or the central Italian markets and plantations.
There are several documents in the collection that attest to the company's direct involvement in plantation operations in Zaragoza, Valencia and in the Umbria region of Italy.3
The map is also interesting for what it shows us about areas the company avoided. Central France and northern Germany do not seem to have been of interest to the company.
Timeline of documents
The company existed roughly 150 years (for comparison, Volkswagen today is only 88 years old). But the documents that we have from Alexius Hilleson mostly cover the latter years of it's existence. Hilleson himself joined the company in 1485, so any earlier documents must have been passed down to him from colleagues or internal company archives.4 You can see the chronology of the documents on this timeline:
The timeline is less spectactular than the map, but it still provides us with important information. Especially the gaps in data are important to keep in mind when researching the company.
Conclusion and Outlook
I'm very impressed with FactGrid and WikiData's capabilities. Graph databases and the interactive visualizations that result from these databases allow for a wholey different analysis of the sources. The built-in query service and visualization options are powerful. FactGrid is especially valuable because it preserves the results from multiple research projects and enables them to build on each other's work.
Now that (almost) all documents are recorded in the FactGrid database with their locations and dates, I think a promising next step would be to create records for the employees, customers, suppliers and contractors. Together with the locations and dates of these documents, we might be able to reconstruct where people moved, with whom they worked and how the company assessed it's priorities. Careers and the internal organization of the company could become apparent.
Finally, I want to reflect a little bit about the limitations of this kind of digitization project. Looking back at the text I wrote about Theophanu at the beginning of this article and comparing it with the graph that resulted from said text, we can see that several important pieces of information are missing. Theophanu's relation to the Byzantine Emperor or her regency during her son's minority are ignored in favor of familial relationships and rather insignificant birth and death information. Digitization projects always require some degree of normalization of the input: If the database stored every detail and accomodated every edge cases, it'd become impossible to work with that database, visualize the results and draw conclusions.
Yet normalization also biases our database model against unusual, extraordinary and unexpected input data. When faced with data that our format cannot accomodate, we either have to adjust our format (i.e. by creating new properties or redefining existing properties) or silently ignore that data. Normalization also overemphasizes certain pieces of information about others. Family relationships, birthdays and deaths are very prominent in the FactGrid database at the cost of more contextual information. Take the entry on Charlemagne for example: Of the 26 properties on his record, 21 are for biographical information about his gender, parents, wifes, religion and so forth. Only one statement describes his career and four statements link to literature, images and the projects that created the entry. No mention is made of Charlemagne politics, his wars and conquests, legacy or his friends, close associates or teachers.
Historical data is incredibly complex and thus normalization is a particularly difficult part of the process that requires constant self reflection. When designing a format thta we want to use in our historical database, we need to ask two questions 1) what information can we gather and 2) which information our data model is (unintentionally) priortizing. The categories we use to store data also reflect our own worldview, biases and the structure of our modern society.
1
See her Wikipedia article as well as Season 1, Episode 12 of the History of the Germans Podcast for more detail on this historical figure.
2
Schulte, Aloys: Geschichte der Großen Ravensburger Handelsgesellschaft: 1380 - 1530, Volume 3, Stuttgart u. Berlin 1923, reprint Wiesbaden 1962.
3
Abrechnung von Klaus Steinhüsler über die Safrananlegung in Aquila und Foligno und den Transport bis Mailand 1479. Dokument 51. Q1853375, in: Schulte: Geschichte der Großen Ravensburger Handelsgesellschaft: 1380 - 1530, pp. 324-326.
4
Verschreibung des Alexius Hilleson gegen die Gesellschaft auf zehn Jahre. 1485 Oktober 26. Dokument 106. Q1787422, in: Schulte: Geschichte der Großen Ravensburger Handelsgesellschaft: 1380 - 1530, pp. 462f.
5
Veronesi, Marco: Oberdeutsche Kaufleute in Genua, 1350–1490. Institutionen, Strategien, Kollektive (Veröffentlichungen der Kommission für geschichtliche Landeskunde in Baden-Württemberg / Reihe B, Forschungen 199), Stuttgart 2014.